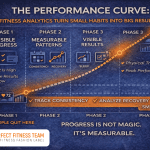
The Performance Curve: How Fitness Analytics Turn Small Habits into Big Results
April 9, 2026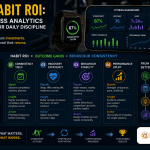
The Habit ROI: How Fitness Analytics Quantify Your Daily Discipline
April 24, 2026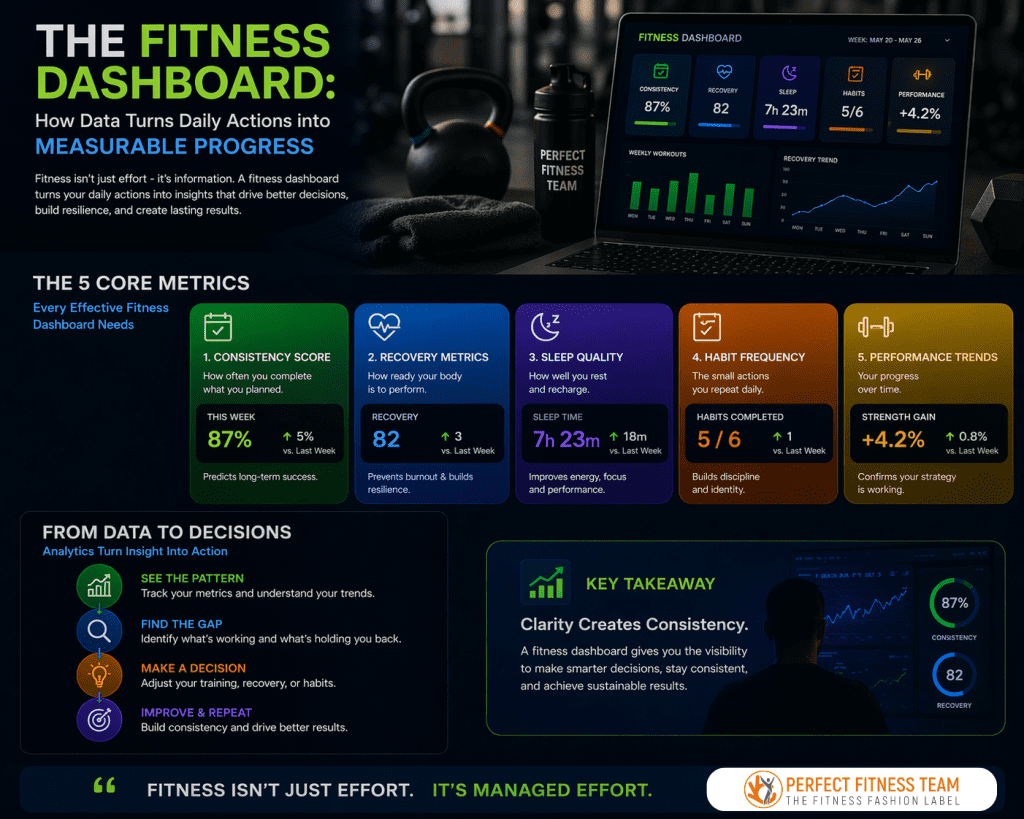
Imagine driving a car without a dashboard.
No speedometer, no fuel indicator, no warning signals.
That’s how most people approach fitness.
They rely on effort, motivation, and occasional feedback — but without clear indicators, they struggle to understand whether they are progressing, stagnating, or heading toward burnout.
At Perfect Fitness Team, we approach fitness like a system — powered by a dashboard of analytics that guide decisions, improve consistency, and build long-term performance.
1. What Is a Fitness Dashboard?
A fitness dashboard is a structured view of the key metrics that influence performance and consistency.
Instead of focusing only on outcomes like weight or appearance, a dashboard tracks leading indicators, such as:
- Workout consistency
- Recovery levels
- Sleep quality
- Habit frequency
- Training load balance
These metrics provide real-time insights into behaviour — helping individuals make informed decisions instead of reactive ones.
2. Why Outcomes Alone Are Misleading
Most people track:
- Weight
- Body measurements
- Visual progress
While useful, these are lagging indicators — they reflect past behaviour, not current patterns.
Analytics shift focus to leading indicators, which predict future outcomes.
For example:
- Consistent training predicts strength gains
- Stable sleep predicts energy levels
- Balanced recovery predicts sustainability
👉 When you track leading indicators, you control results before they appear.
3. The Core Metrics of a Fitness Dashboard
To build an effective dashboard, focus on these five key analytics:
🔹 1. Consistency Score
Tracks how often you complete planned workouts.
👉 The strongest predictor of long-term success.
🔹 2. Recovery Metrics
Includes sleep quality, resting heart rate, and readiness scores.
👉 Indicates whether your body can perform optimally.
🔹 3. Training Load Balance
Measures how intensity is distributed over time.
👉 Prevents overtraining and stagnation.
🔹 4. Habit Frequency
Tracks behavioural patterns such as workouts, mobility, hydration, and steps.
👉 Reveals whether your system is stable.
🔹 5. Performance Trends
Tracks progress in strength, endurance, or output.
👉 Shows whether your strategy is working.
4. From Data to Decision-Making
Analytics are only valuable if they guide action.
A fitness dashboard enables decisions such as:
- Adjusting intensity when recovery is low
- Increasing training frequency when consistency stabilizes
- Improving sleep routines when performance drops
- Identifying habit gaps before they affect results
This transforms fitness from reactive effort into proactive strategy.
5. How Analytics Build Mental Strength
One of the most overlooked benefits of fitness analytics is psychological.
Tracking data:
✔ Reduces uncertainty
✔ Builds accountability
✔ Reinforces discipline
✔ Creates trust in the process
Instead of relying on motivation, individuals rely on structure and feedback.
And structure is what builds resilience.
6. Building Your Own Fitness Dashboard
To implement this approach:
📊 Track weekly consistency (not just daily workouts)
📊 Monitor recovery trends alongside performance
📊 Focus on patterns, not isolated data points
📊 Keep your dashboard simple (5–6 metrics max)
📊 Review data regularly and adjust behaviour
The goal is not perfection —
it is clarity.
Conclusion: Clarity Drives Consistency
Fitness becomes easier when it becomes understandable.
A dashboard provides:
- Visibility into behaviour
- Control over decisions
- Confidence in progress
At Perfect Fitness Team, we believe that data is not just for measurement — it is for direction.
Fitness is not just effort.
It is managed effort.
And analytics are how you manage it.